This project tracks forecast confidence trends, deal hygiene signals, and weighted pipeline quality over time.
Forecast Quality Dashboard
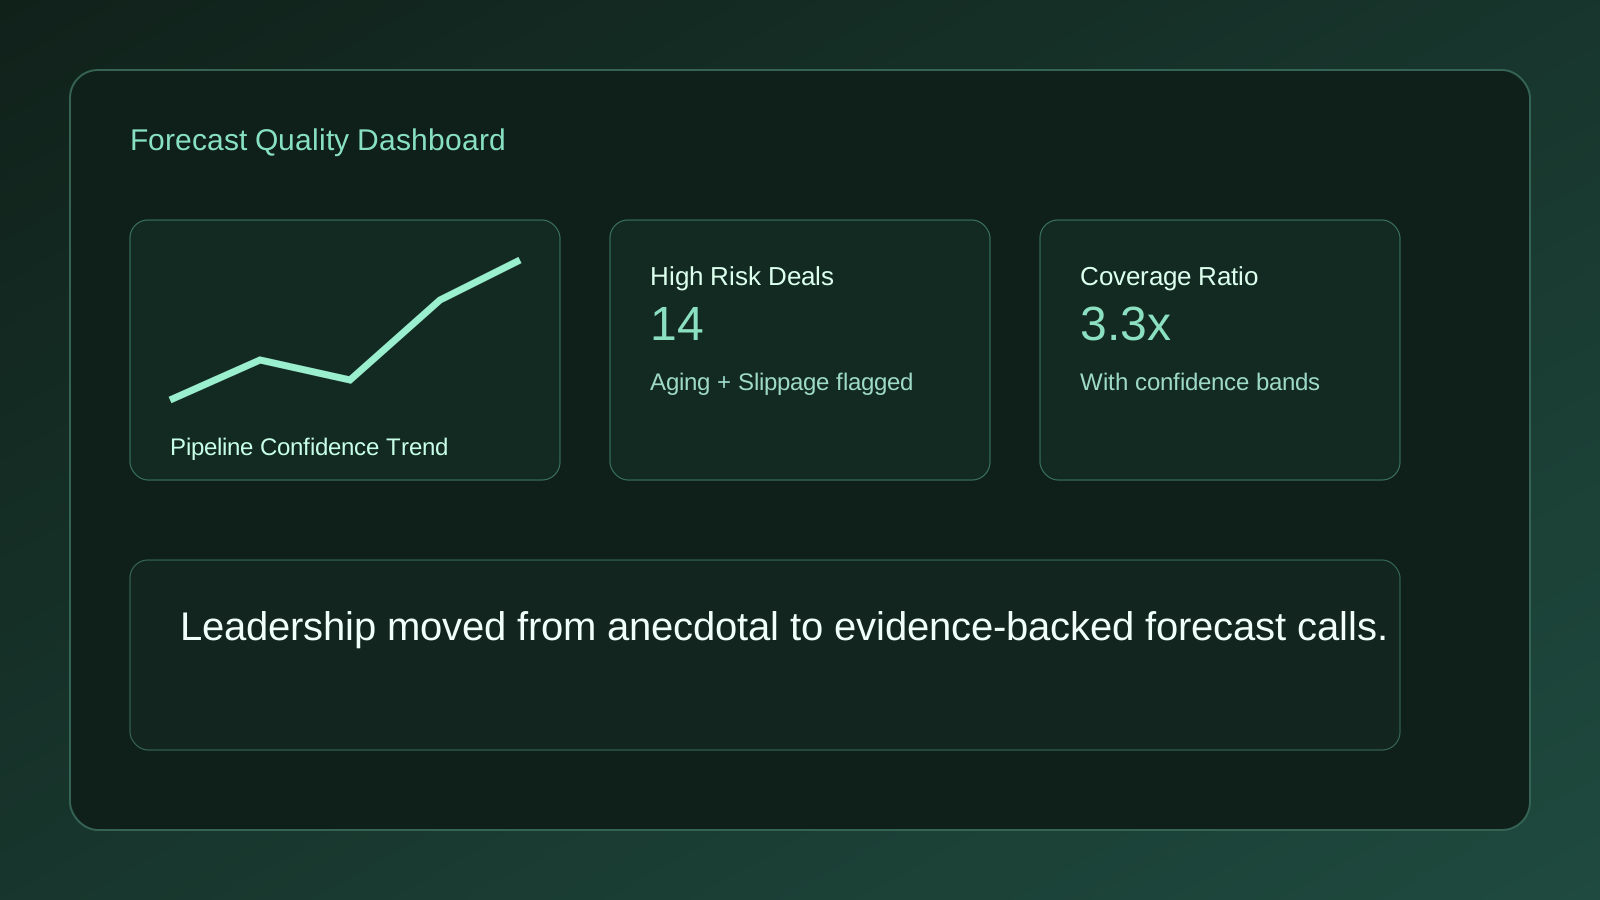
A dashboard designed to surface forecast risk and pipeline confidence by segment.
What I set out to do
What this project is designed to do
These are the goals for this project, rather than measured results.
Faster weekly review prep
Meeting prep shifted toward decision-focused inspection.
Shared risk rubric
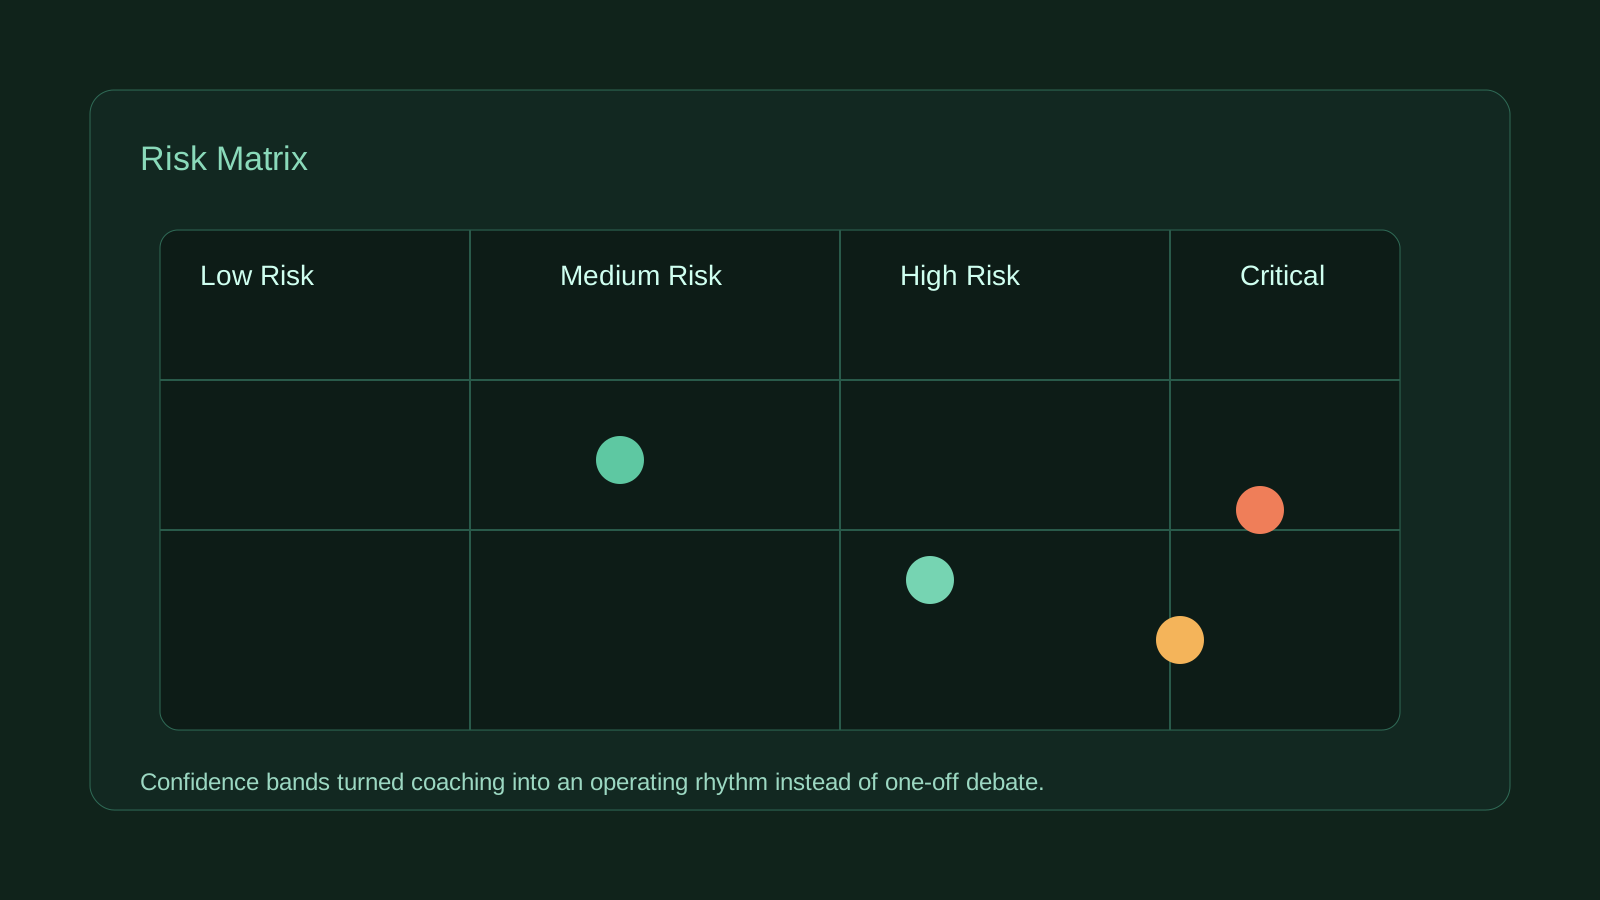
One framework reduced interpretation drift across reviewers.
Single inspection surface
Leadership review moved from distributed reports to one dashboard.
Before / after
- Forecast reviews were anecdotal and varied by manager.
- Deal risk indicators were scattered across multiple dashboards.
- Quarter commitments lacked confidence scoring and exception tracking.
- Unified dashboard surfaced risk signals in a shared inspection workflow.
- Confidence bands were tied to objective pipeline hygiene indicators.
- Leadership reviews moved from narrative-heavy to evidence-backed decisions.